Dashboard overview
The Dashboard summarizes your logbook with charts, totals, limitations, and progress views. You can customize it so the information you check most often stays easy to reach.
In MyLog 2.6.0, Dashboard includes more sector analytics, PM/PF distribution, timeframe controls, and shareable widgets.
Where to find it
Open Dashboard from the main app navigation.
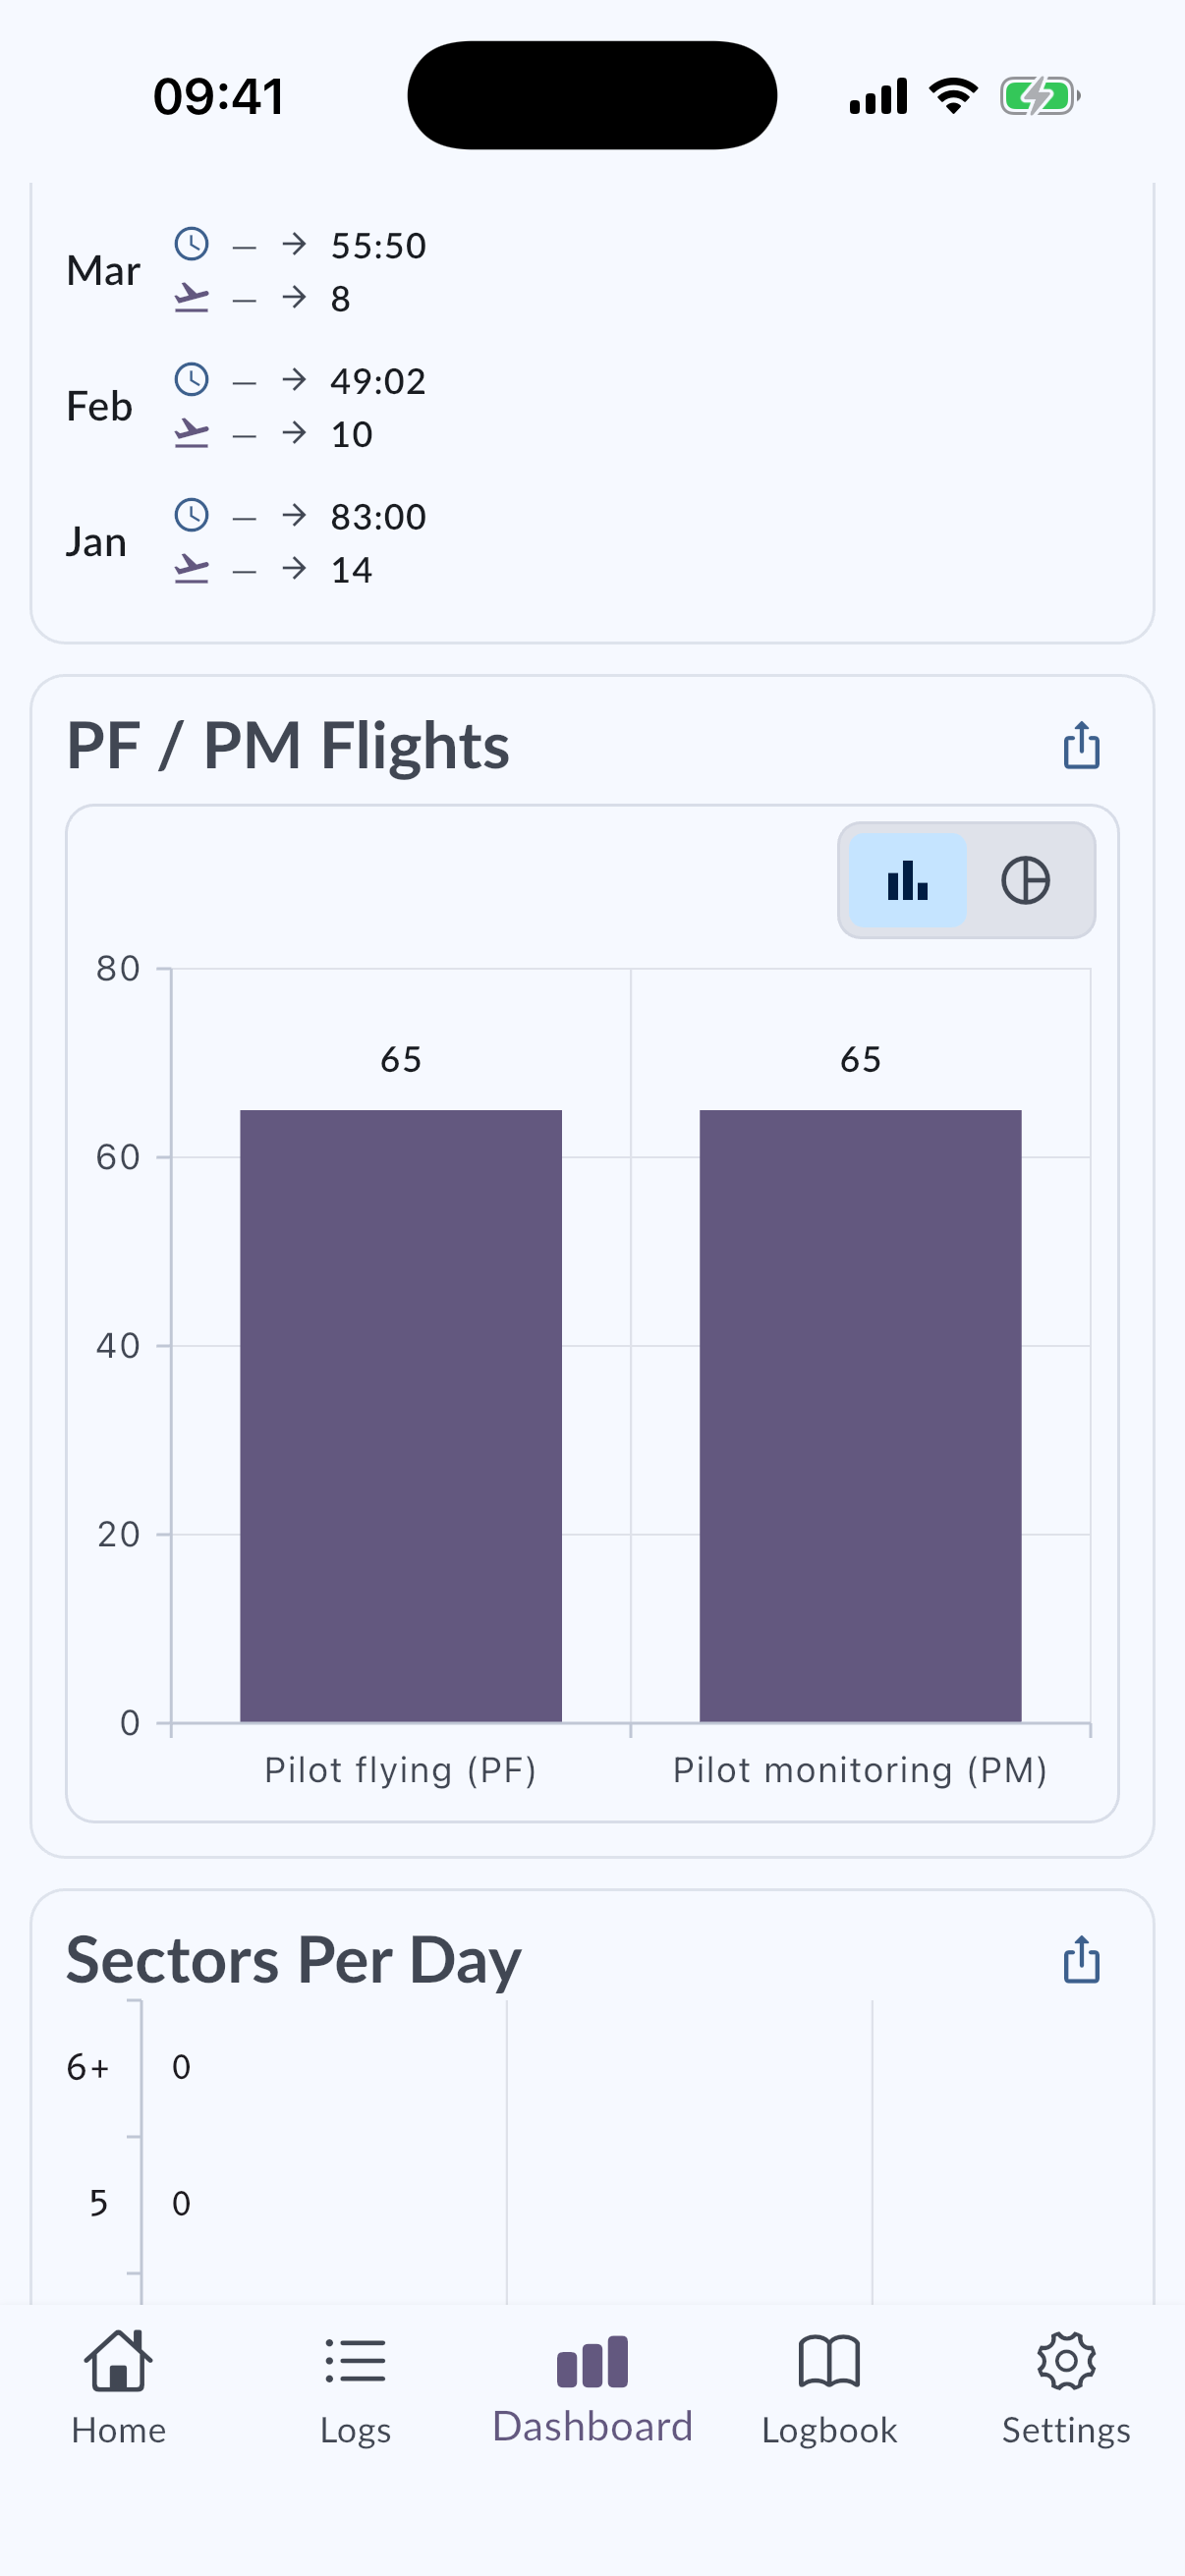
Tablet users can see Dashboard content on the Home screen. On larger screens, Dashboard is designed as a two-column layout instead of a separate phone-style screen.
Dashboard widgets
Dashboard widgets can show different parts of your logbook, such as:
- Flight hour summaries.
- Sector summaries.
- PM/PF counts.
- Takeoff and landing statistics.
- Monthly and yearly trends.
- Limitations and current totals.
You can customize the Dashboard by adding, removing, hiding, or reordering widgets, depending on the widget type and app layout.
Timeframe controls
Dashboard timeframe controls let you choose which period the Dashboard should use.
You can use preset periods or choose a custom range. Custom ranges can also be open-ended:
- No Start Date / Since Beginning: include records from the beginning of your logbook until the selected end.
- No End Date / Until Now: include records from the selected start until now.
Use timeframe controls when you want to compare a specific month, year, training period, company period, or any custom part of your logbook.
Sector analytics
Dashboard can show sector activity across different periods, including monthly sectors, yearly sectors, average monthly sectors by year, and sectors flown in a UTC day.
The UTC-day sector view helps you understand common duty patterns, such as whether you usually fly two-sector or four-sector days. Positioning records can also count toward sector totals when they are recorded that way.
For month-focused planned versus actual tracking, see Monthly progress and targets.
PM/PF counts
The PM/PF widget summarizes how often you logged yourself as Pilot Monitoring or Pilot Flying. Use it to review your logged function distribution over the selected Dashboard timeframe.
Sharing Dashboard widgets
Some Dashboard widgets can be shared as images. Long-press a supported widget and use the available share or download action.
This can be useful for saving a quick visual summary or sharing a chart outside the app.
Reading chart values
MyLog 2.6.0 improves several Dashboard charts so values and labels are easier to read. If a chart has many entries, use the available scrolling or timeframe controls to narrow the data.