My Flights Heat Map
My Flights Heat Map is a Dashboard widget that colours the countries you have flown to on a world map. The more often you visited a country, the warmer its colour. You can explore the map, play your flying history as a full-screen animation, and share the result as an image or a video.
Where to find it
Open Dashboard and scroll to My Flights Heat Map. If you do not see it, choose Customize Dashboard and turn the widget on.
The map uses the Dashboard period you have selected, so changing the period changes the map. See Dashboard overview.
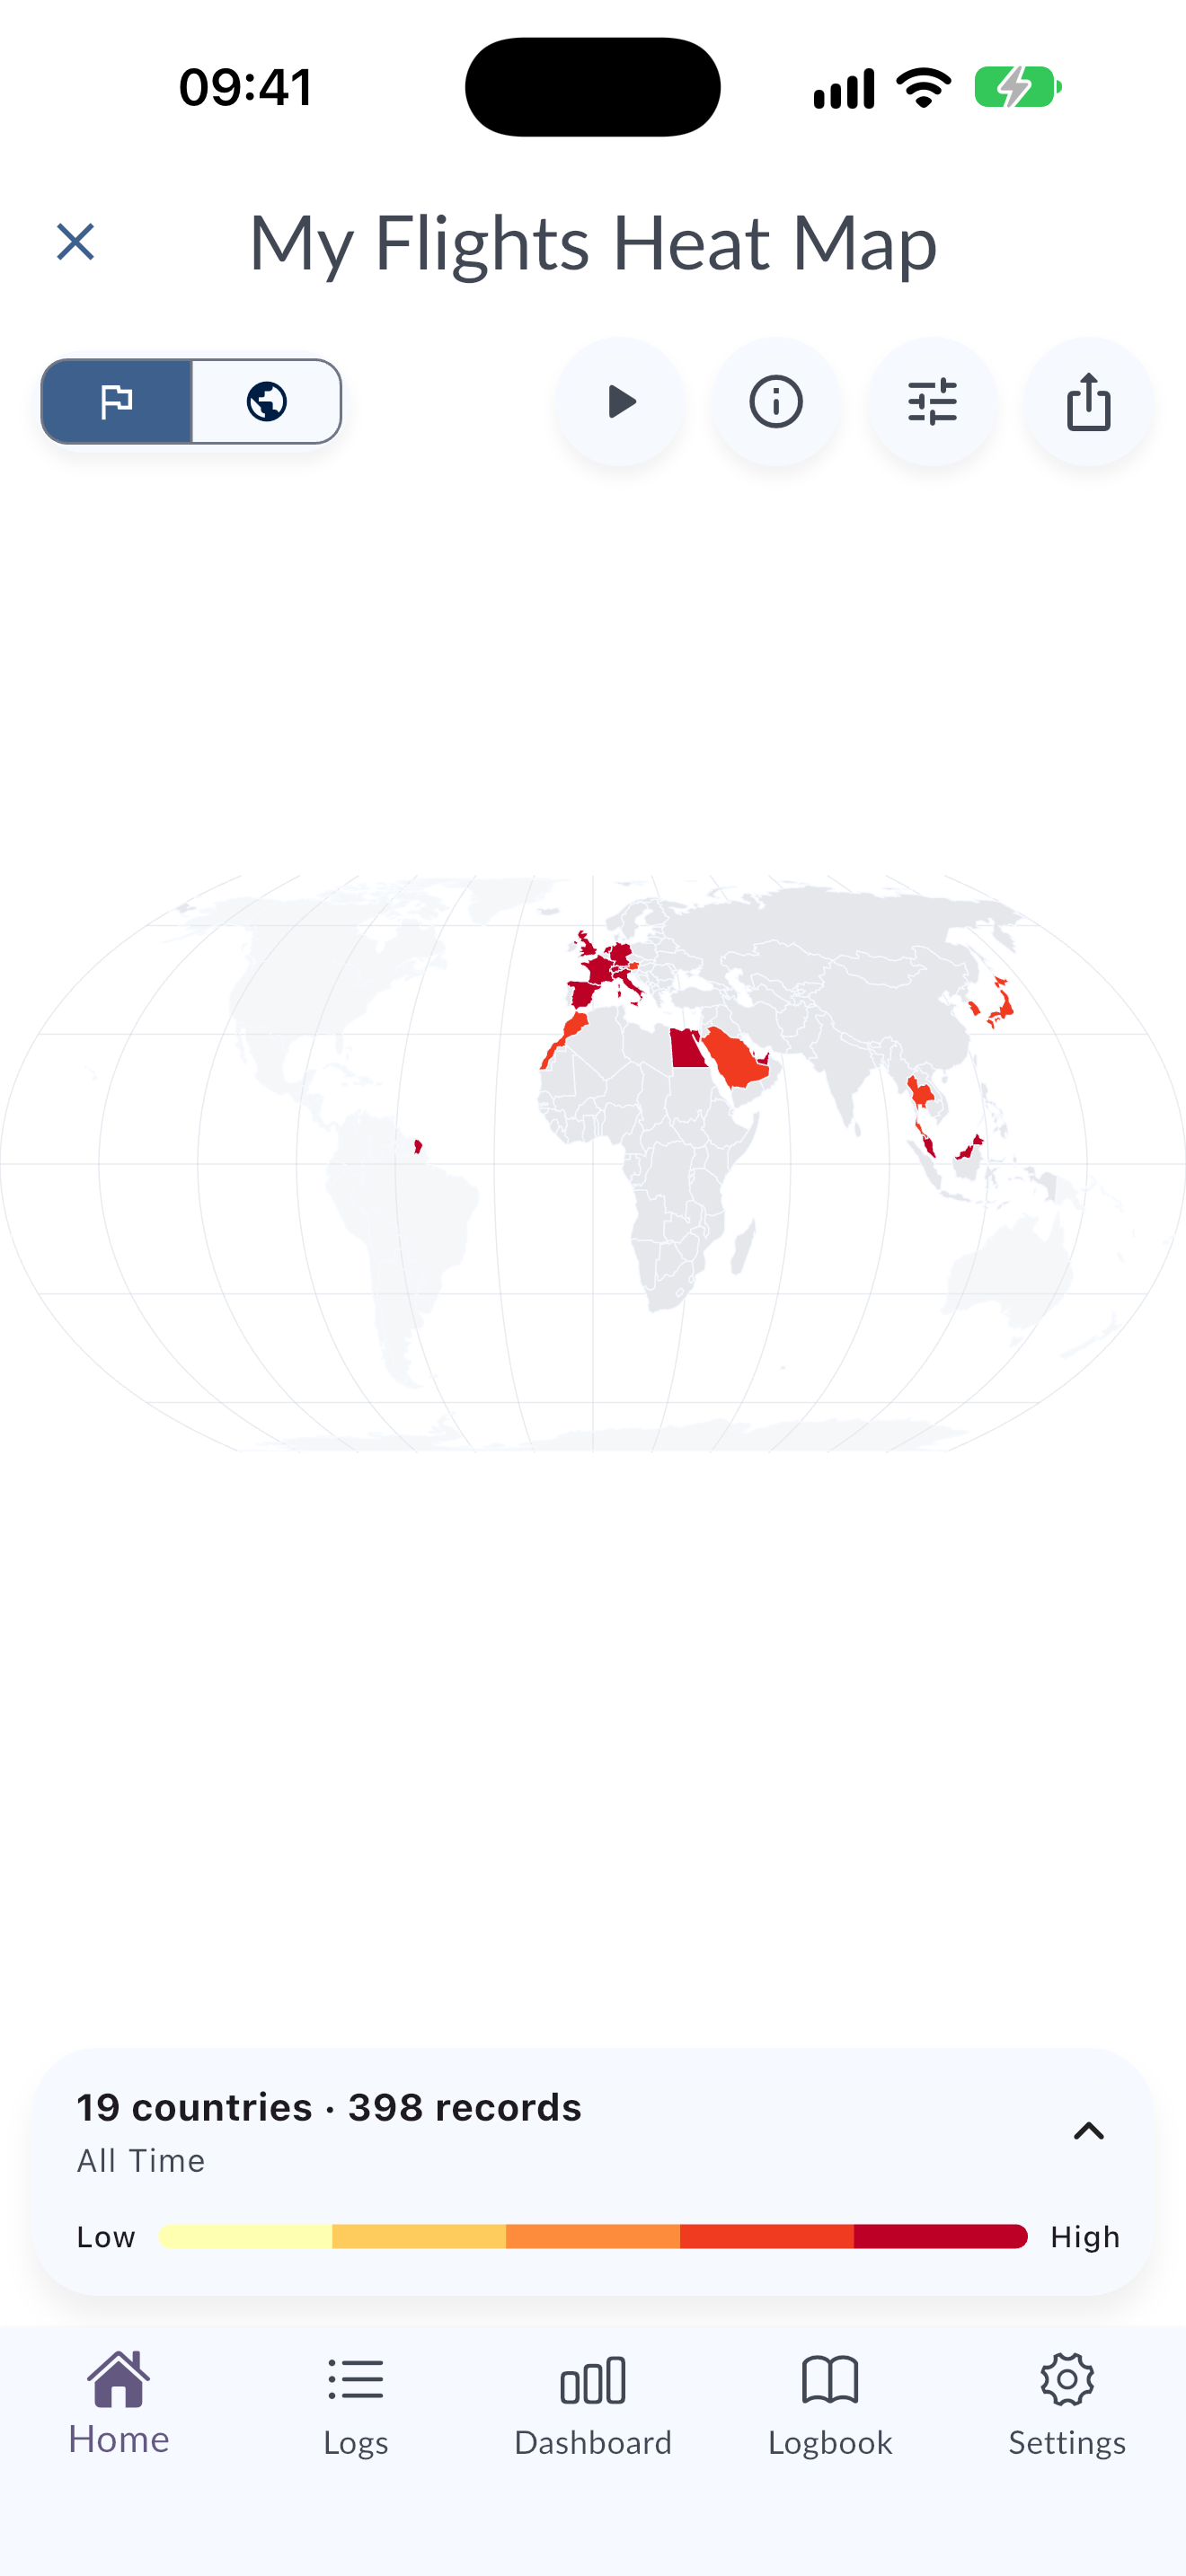
What the widget shows
- Summary line: the number of countries and records the map is based on, for example "12 countries · 148 records".
- World map: each country is coloured from Low to High. Countries with no included visits stay neutral.
- Countries / Regions: switch between a country view and a region view.
- Most active: the countries or regions with the most visits in the period.
- Info icon (How this map works): opens a screen that explains how the map is calculated.
Country and region views
In Countries view every country has its own colour. In Regions view, countries are grouped into Americas, Europe, Africa, Middle East, Asia and Oceania. Türkiye and Cyprus are grouped under Europe, and Egypt is grouped under Africa.
Use the region chips to choose what the map focuses on:
- Auto: MyLog keeps the world context and frames the map for you.
- Select one or more regions to hide the others and reframe the map around your choice.
- Show all shows every region again, and Reset returns to the automatic view.
How the map is calculated
The map is built on your device from your synced MyLog records.
- Records included: valid flight and positioning records in the selected period. Simulator records are not included.
- Visits: each record adds one visit to every distinct departure and arrival country. A domestic record counts once for its country, not twice.
- Home base: when a home base airport is set in your profile, a flight that returns to that base does not add a visit to the home country, so routine returns do not inflate its colour. Departures from the base still count.
- Colours: there are five heat levels, calculated relative to the busiest country or region in the current view. A logarithmic scale keeps a frequent destination from hiding the rest of your activity.
- Unknown airports: if a record's departure or arrival country cannot be identified, that end of the record is not used to colour the map. The widget tells you how many endpoints could not be mapped.
Play the animated journey
Tap the map (Tap to explore) or Play animated journey to open the full-screen player.
- The camera follows your route, a trail is drawn behind each flight, and each landing pulses on the map.
- Airport codes appear on the map, along with the flight number, callsign or registration of the current flight.
- Use Pause, Resume and Replay to control playback. The counter shows how many records have played, for example "12 of 148 records".
- Use Playback speed to choose a speed from 0.5x to 4x.
- Tap Exit animation to return to the Dashboard.
Domestic flights and flights that return to your home base are counted on the map but do not draw a flight path or move the camera.
Share your heat map
Choose Share story to share the map. Pick a format:
- Heat Map Image (PNG): a 1080 × 1920 image, ready to share.
- Heat Map Animation (Video): a silent 1080 × 1920 video, ready to share on social media.
The image and the video use the same period, regions, visit counts and colours that you see on screen.
Video export
The video is prepared on your device, so it does not need a connection.
- Choose Heat Map Animation (Video).
- If MyLog already has access to your photo library, it asks Save the finished video? Choose Yes, save automatically or No, don't save automatically.
- Wait while MyLog prepares the map, renders the journey and encodes the video. A progress percentage and an estimate of the remaining time are shown. You can keep using the app, but keep MyLog open.
- When the video is ready, MyLog sends a notification: Your heat map video is ready! Tap it to preview, save or share the video.
The finished video stays available in MyLog, including after you restart the app. To stop an export, choose Cancel video.
If an export is interrupted, a Video export paused notification asks you to open MyLog to continue.
Empty and error states
- No flight or positioning records for this period: the selected period has no records that can be shown. Choose a longer period.
- The heat map could not be prepared: try again, or choose a different period.
- Photo access is needed to save this video: allow photo access in your device settings and try again, or share the video with another app instead.
- The video could not be prepared. Please try again.: start the export again. If the problem continues, contact support.
Tips
- Use All times or This year for a complete picture, and This month to share a recent trip.
- Set your home base in your profile so routine returns do not dominate the map.